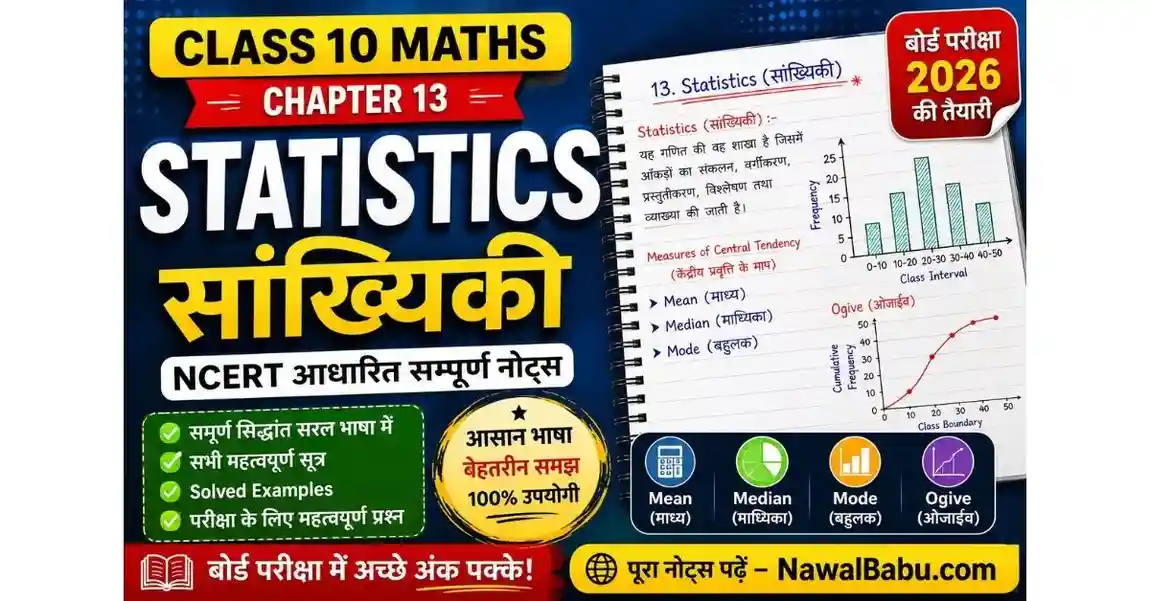
Statistics Class 10 Notes: कक्षा 10 गणित का अध्याय “Statistics (सांख्यिकी)” बोर्ड परीक्षा की दृष्टि से अत्यंत महत्वपूर्ण अध्याय है। इस अध्याय में विद्यार्थियों को आँकड़ों (Data) का विश्लेषण करना तथा उनसे उपयोगी निष्कर्ष निकालना सिखाया जाता है। NCERT के अनुसार इसमें मुख्य रूप से Mean (माध्य), Median (माध्यिका), Mode (बहुलक), Cumulative Frequency (संचयी बारंबारता) तथा Ogive (ओजाइव) का अध्ययन किया जाता है।
ये सभी विषय न केवल बोर्ड परीक्षा बल्कि प्रतियोगी परीक्षाओं में भी महत्वपूर्ण भूमिका निभाते हैं। इस पोस्ट में आपको Statistics Chapter के सभी महत्वपूर्ण सिद्धांत, सूत्र, परिभाषाएँ तथा हल करने की विधियाँ सरल हिन्दी और English भाषा में समझाई गई हैं ताकि आप कम समय में पूरे अध्याय का प्रभावी ढंग से पुनरावृत्ति कर सकें और परीक्षा में अच्छे अंक प्राप्त कर सकें। Download NCERT BOOK PDF.
Statistics Class 10 Notes: Notes & Formula
Statistics (सांख्यिकी) is the branch of Mathematics that deals with the collection, organization, presentation, analysis, and interpretation of numerical data. In Class 9, we studied Mean, Median, and Mode for ungrouped data. In Class 10, we learn how to find these measures for grouped data and how to represent cumulative frequencies using an Ogive.
सांख्यिकी हमें बड़ी मात्रा में उपलब्ध आँकड़ों को समझने और उनका विश्लेषण करने में सहायता करती है। इसका उपयोग शिक्षा, चिकित्सा, व्यापार, खेल, जनगणना तथा वैज्ञानिक अनुसंधान में किया जाता है।
Statistics and Data | सांख्यिकी एवं आँकड़े
- Data (आँकड़े) are numerical facts collected for a particular purpose.
- Data may represent marks, heights, weights, ages, income, etc.
- Raw data are unorganized facts collected directly from observations.
- To make conclusions from data, we organize them into tables.
- Statistics helps in comparing different situations and making decisions.
- Example: Marks of students in an examination, population of cities, rainfall records, etc.
Important Point: Large data are difficult to understand in raw form, so they are grouped into classes.
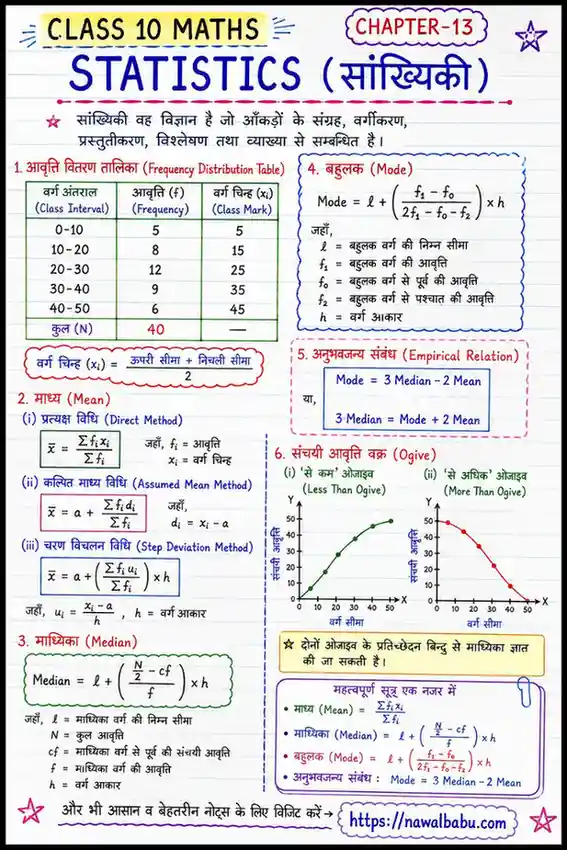
Frequency Distribution | बारंबारता वितरण
- Frequency means the number of times a value occurs.
- A frequency distribution table organizes data into classes and frequencies.
- It makes data easy to understand and analyze.
- Each class has:
- Lower Limit (निम्न सीमा)
- Upper Limit (उच्च सीमा)
- Frequency (बारंबारता)
Example
| Class Interval | Frequency |
|---|---|
| 0-10 | 5 |
| 10-20 | 8 |
| 20-30 | 12 |
Here, 12 students have marks between 20 and 30.
Important: Sum of all frequencies = Total number of observations.
Measures of Central Tendency | केंद्रीय प्रवृत्ति के माप
The value that represents the entire data is called a measure of central tendency.
There are three measures:
- Mean (माध्य)
- Median (माध्यिका)
- Mode (बहुलक)
These values represent the center of the data.
Mean of Grouped Data | समूहित आँकड़ों का माध्य
Mean is the average value of observations.
Formula
Where,
- = frequency
- = class mark
Class Mark | वर्ग चिन्ह
The midpoint of a class interval is called class mark.
Formula
Example
Class Interval = 20–30
Methods of Finding Mean | माध्य ज्ञात करने की विधियाँ
There are three methods:
- Direct Method
- Assumed Mean Method
- Step Deviation Method
Direct Method | प्रत्यक्ष विधि
In this method, we calculate class marks and multiply them by frequencies.
Formula
Steps
- Find class marks.
- Calculate
- Find and .
- Apply the formula.
Advantage: Easy for small numbers.
Disadvantage: Lengthy for large numbers.
Assumed Mean Method | कल्पित माध्य विधि
This method simplifies calculations.
Choose any class mark as assumed mean a.
Then,
Formula:
Steps
- Select assumed mean.
- Calculate deviations.
- Multiply by frequencies.
- Apply formula.
This method reduces calculations considerably.
Step Deviation Method | चरण विचलन विधि
This method is used when class intervals are equal.
Formula:
where,
- = assumed mean
- = class size
Mean Formula:
Advantages
- Faster calculations.
- Suitable for large numbers.
- Widely used in competitive exams.
Median of Grouped Data | समूहित आँकड़ों की माध्यिका
Median is the middle value of the data.
It divides the observations into two equal parts.
Formula
Where,
- = lower boundary of median class
- = total frequency
- = cumulative frequency before median class
- = frequency of median class
- = class size
Steps to Find Median
- Find cumulative frequencies.
- Calculate .
- Identify the median class.
- Apply the formula.
Important: Median class is the class whose cumulative frequency is just greater than .
Cumulative Frequency | संचयी बारंबारता
The running total of frequencies is called cumulative frequency.
Example
| Frequency | Cumulative Frequency |
|---|---|
| 5 | 5 |
| 8 | 13 |
| 12 | 25 |
Importance
- Helps in finding median.
- Used for drawing ogive.
- Makes data analysis easier.
Mode of Grouped Data | समूहित आँकड़ों का बहुलक
Mode is the value that occurs most frequently.
The class having the highest frequency is called the modal class.
Formula
Where,
- = lower limit of modal class
- = frequency of modal class
- = preceding frequency
- = succeeding frequency
- = class size
Steps to Find Mode
- Identify the highest frequency.
- Find modal class.
- Write values of .
- Apply formula.
Empirical Relation | अनुभवजन्य संबंध
For moderately skewed data,
or
This relation is useful when one value is missing.
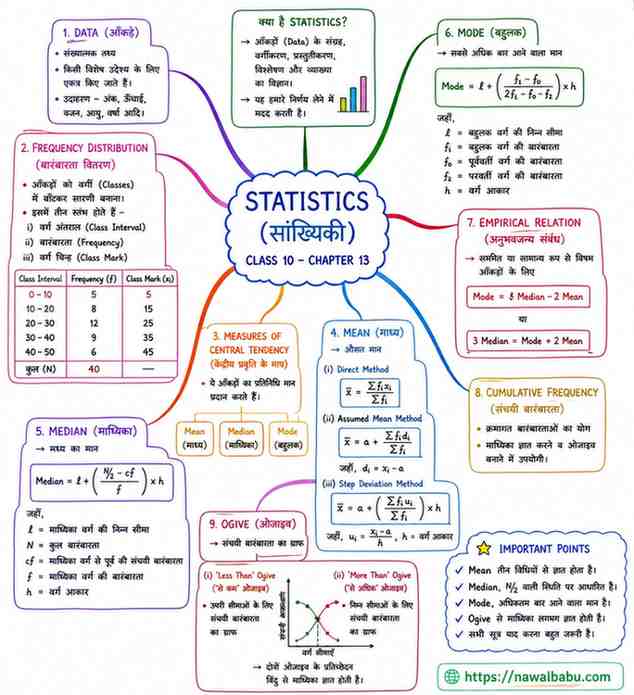
Graphical Representation of Cumulative Frequency | संचयी बारंबारता का ग्राफ
The graph of cumulative frequency is called an Ogive.
There are two types:
- Less Than Ogive
- More Than Ogive
The intersection point of both curves gives the Median.
Less Than Ogive | ‘से कम’ ओजाइव
- Plot upper class boundaries on x-axis.
- Plot cumulative frequencies on y-axis.
- Join the points smoothly.
This curve increases continuously.
More Than Ogive | ‘से अधिक’ ओजाइव
- Plot lower class boundaries on x-axis.
- Plot cumulative frequencies on y-axis.
- Join the points smoothly.
This curve decreases continuously.
Finding Median from Ogive | ओजाइव से माध्यिका ज्ञात करना
- Draw both ogives.
- Mark their point of intersection.
- Draw a perpendicular to the x-axis.
- The x-coordinate gives the median.
This is a graphical method and gives an approximate value.
Important Formulae | महत्वपूर्ण सूत्र
Mean (Direct Method)
Mean (Assumed Mean Method)
Mean (Step Deviation Method)
Median
Mode
Empirical Relation
Exam Tips | परीक्षा के लिए महत्वपूर्ण बातें
✅ Median class = Cumulative frequency just greater than N/2.
✅ Modal class = Highest frequency class.
✅ Mean can be calculated by three methods.
✅ Ogive is used to find Median graphically.
✅ Remember all formulas carefully.
✅ Always check total frequency before solving questions.
Know more: How do Organisms Reproduce Class 10 Notes in Hindi & English | जीव कैसे प्रजनन करते हैं पूर्ण नोट्स
Statistics Class 10 Notes: अध्याय का सारांश
- Statistics deals with data collection and analysis.
- Mean represents the average value.
- Median is the middle observation.
- Mode is the most frequent observation.
- Cumulative frequency helps in finding median.
- Ogive is the graphical representation of cumulative frequency.
- Empirical relation connects mean, median, and mode.
These concepts are extremely important for CBSE, Bihar Board, and other board examinations.